Spring Boot Actuator provides assistance for application monitoring. Out of the box it provides information on application health, configuration and logging. It’s trivial to enable: simply add the spring-boot-starter-actuator dependency to a Spring Boot project in Maven or Gradle and it just works! The monitoring information is provided as JSON from HTTP endpoints or via JMX.
The Spring Boot Actuator trace endpoint is particularly handy. By default it shows the last 100 HTTP requests made to the application. This article walks through an Actuator demo and shows some of the configuration options to get the best from this feature.
The source code for this article is available from GitHub.
Enabling Spring Boot Actuator
Spring Boot Actuator can be enabled simply by adding the Starter dependency. In Maven, this looks like:
<dependency>
   <groupId>org.springframework.boot</groupId>
   <artifactId>spring-boot-starter-actuator</artifactId>
</dependency>
Better yet, if you’re creating a brand new Spring Boot project, use the Spring Boot Initializr and select Actuator as a dependency.
Then build and start the application.
Enabling the Spring Boot Actuator Trace endpoint
The trace endpoint is at http://localhost:8080/trace. Unfortunately, if you try this without any config, you’ll see an error:
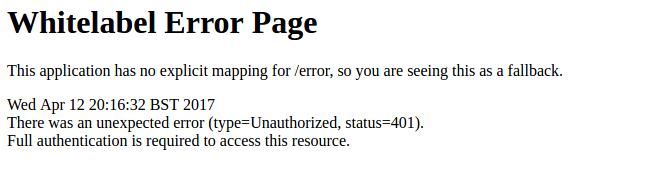
This is because the /trace endpoint is marked as sensitive by default. Spring Boot rightly recognises that you wouldn’t want trace information exposed to the world so locks it down and makes it accessible only to logged in users. If the application does not include web security, the sensitive endpoint is simply disabled.
If you’re not concerned with exposing trace information, this security feature can be bypassed. Please give proper consideration before you do this. If your application is web facing or accessible to ordinary users, you probably don’t want to bypass security. Instead, you’d want to use Spring Security to allow / deny access. If however it is acceptable to expose trace information, you can mark it as public by adding a setting to the application.properties:
endpoints.trace.sensitive=false
Spring Boot Actuator Trace information
Now restart the application and try http://localhost:8080/trace again. You shouldn’t get an error but the result is somewhat uninteresting:
[]
That’s an empty JSON array. It’s empty because the application has just started and no HTTP requests have been captured yet. Try refreshing the page:
[{"timestamp":1492025398603,"info":{"method":"GET","path":"/trace","headers":{"request":{"host":"localhost:8080","connection":"keep-alive","cache-control":"max-age=0","upgrade-insecure-requests":"1","user-agent":"Mozilla/5.0 (X11; Linux x86_64) AppleWebKit/537.36 (KHTML, like Gecko) Ubuntu Chromium/53.0.2785.143 Chrome/53.0.2785.143 Safari/537.36","accept":"text/html,application/xhtml+xml,application/xml;q=0.9,image/webp,*/*;q=0.8","accept-encoding":"gzip, deflate, sdch","accept-language":"en-GB,en-US;q=0.8,en;q=0.6","cookie":"Webstorm-ad32f8e6=a9280b8b-30f6-48b2-bd4a-09acfeedcf12"},"response":{"X-Application-Context":"application:8080","Content-Type":"application/vnd.spring-boot.actuator.v1+json;charset=UTF-8","Transfer-Encoding":"chunked","Date":"Wed, 12 Apr 2017 19:29:58 GMT","status":"200"}}}}]
The previous request to /trace has been captured and is shown in the trace. It may be a little hard to read in a web browser so you may want to request the page in Postman or similar.
[
  {
    "timestamp": 1492025463683,
    "info": {
      "method": "GET",
      "path": "/trace",
      "headers": {
        "request": {
          "host": "localhost:8080",
          "connection": "keep-alive",
          "cache-control": "max-age=0",
          "upgrade-insecure-requests": "1",
          "user-agent": "Mozilla/5.0 (X11; Linux x86_64) AppleWebKit/537.36 (KHTML, like Gecko) Ubuntu Chromium/53.0.2785.143 Chrome/53.0.2785.143 Safari/537.36",
          "accept": "text/html,application/xhtml+xml,application/xml;q=0.9,image/webp,*/*;q=0.8",
          "accept-encoding": "gzip, deflate, sdch",
          "accept-language": "en-GB,en-US;q=0.8,en;q=0.6",
          "cookie": "Webstorm-ad32f8e6=a9280b8b-30f6-48b2-bd4a-09acfeedcf12"
        },
        "response": {
          "X-Application-Context": "application:18080",
          "Content-Type": "application/vnd.spring-boot.actuator.v1+json;charset=UTF-8",
          "Transfer-Encoding": "chunked",
          "Date": "Wed, 12 Apr 2017 19:31:03 GMT",
          "status": "200"
        }
      }
    }
  }
]
That’s more readable but there are improvements we can make.
Fix the timestamp
Each request is timestamped. Unfortunately the timestamp is in the Java numeric format and hard to read.
"timestamp": 1492025463683
This can be formatted with a configuration option. Add this to the application.properties:
spring.jackson.date-format=yyyy-MM-dd HH:mm:ss
Now the timestamp in the trace output looks like this:
"timestamp":"2017-04-12 19:44:30"
Turn down the noise
The trace format is quite verbose. By default it includes request headers, response headers, cookies and errors. Also, by default request parameters are not logged. So if you request http://localhost:8080/simple?param1=value1¶m2=value2, the trace info will include
    "info": {
      "method": "GET",
      "path": "/simple",
but the parameters will be lost. Exactly what is logged is just as easy to confgure. I want to disable logging of headers and cookies and just log request parameters and errors. Again, this is a setting in application.properties:
management.trace.include=parameters,errors
Now each trace entry looks like this:
[
  {
    "timestamp": "2017-04-12 19:52:27",
    "info": {
      "method": "GET",
      "path": "/simple",
      "headers": {},
      "parameters": {
        "param1": [
          "value1"
        ],
        "param2": [
          "value2"
        ]
      }
    }
  }
]
The full list of options is defined by the TraceProperties configuration properties class.
Bug: Request parameters not logged
There is a bug in some versions of Spring Boot that causes request parameters not to appear in request parameters even when the parameters value is included in the management.trace.include property. If you find that the parameters JSON element is present but always empty, this could be the cause:
"parameters": {}
This issue affects versions 1.4.5 and below as well as version 1.5.0 – 1.5.2. The recommended fix is to upgrade to the latest release of Spring Boot. Note that at time of writing, 1.4.6 and 1.5.3 are not yet released so you may have to wait.
If you’re unable to upgrade, there is a workaround. Setting the system property org.apache.catalina.connector.RECYCLE_FACADES to true forces the embedded Tomcat to behave in a way more friendly to the Spring Boot Actuator trace. This can be done from command line:
java -Dorg.apache.catalina.connector.RECYCLE_FACADES=true -jar target/actuator-demo-0.0.1-SNAPSHOT.jar
Or from within the application itself – set it before SpringApplication.run() is called:
public static void main(String[] args) {
	System.setProperty("org.apache.catalina.connector.RECYCLE_FACADES", "true");
	SpringApplication.run(ActuatorDemoApplication.class, args);
}
Example of the issue and the fix / workaround are shown in the Actuator demo example in GitHub:
Hi Stuart,
If the HTTP method is POST, then the request & response body won’t be available in this trace.
Is there any way to trace this?
Hi Jerin
Out of the box, no, Spring Boot does not support logging request and response body. However, it should be fairly easy to get this going. I’d suggest you start with the provided implementation of WebRequestTraceFilter. This is the class that captures the requests and responses for trace logging. You could extend it to capture anything you like.
Spring Boot autoconfigures a WebRequestTraceFilter bean using the @ConditionalOnMissingBean annotation – see TraceWebFilterAutoConfiguration. That should mean that if you declare your own subclass implementation of WebRequestTraceFilter as a Bean, Spring Boot should pick up your custom implementation instead of the provided one.
Best of luck and let me know how you get on!
Hi, I did it once. It’s not “that” easy, because such filter would consume the InputStream of the request. Business logic would not be able to read it afterwards unless you do some ugly hacks replacing the InputStream with ByteArrayInputStream.
These properties seem to be deprecated under Spring Boot 2.0.4.RELEASE
How do I get this trace information into the spring logging system so that this data shows up in my logs? Otherwise I’d have to manually view this endpoint which isn’t very useful.
Hi Esan
The actuator endpoints are intended largely for monitoring of your application rather than logging. If you want to log HTTP requests, I’d recommend using a RequestFilter or HandlerInterceptor. A couple of examples what I mean are Spring – Log Incoming Requests (Baeldung) and Spring Boot – How to log all requests… (Stack Overflow). Yes, the first answer on SO suggests using Actuator but I’m not sure it meets your needs.
If you really want to use the Actuator mechanism to write to logs as requests come in (rather than list requests manually), it should be possible. I’d suggest starting with HttpTraceRepository (previously just called TraceRepository in Spring Boot 1.x). The add method is called whenever a request is received so you could hang your logging code there. Maybe subclass InMemoryHttpTraceRepository and extend its add method to log the HttpTrace information before calling the superclass.
Thanks, nice post!