A year or two back I was working on a web application which was expected to have moderate use – around 50 concurrent users. The product was generally getting thumbs up from our QA guys. It did everything we expected it to do. Then we had a go at testing under load.
Bang!
We found that if we had only a few users hammering the system for any length of time, the memory usage became unacceptable. Simple maths showed that the problem was to do with the number of open sessions. Each session required 20-30MB of memory from the app server. This is a piddly small amount when we have a handful of test users. It went completely unnoticed against the background noise of a typical server’s memory use. However, once just a hundred sessions have been opened (not necessarily at the same time) we’re chewing gigabytes at a time.
This sort of problem is often very hard to reproduce and track down. They’re usually insidious – they appear gradually only after the system has been running under load for a long time. So using a debugger to step through code is useless until you have a very good idea of where to look. Also, we found some problems originated in third party code – again, very hard to debug. Most bugs you’d usually have a good idea of the method or class at fault. This is less likely for memory problems. So we have to start with the big picture by analysing the system as a whole and drilling down gradually. Some tools exist to help this kind of analysis.
Load Testing: WAPT
WAPT is a simple and powerful tool for load testing web applications.
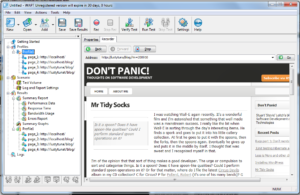
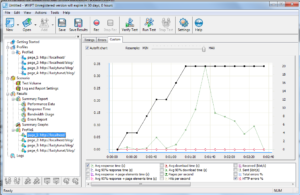
WAPT contains a simple web browser. You can ‘record’ a test session in the browser just by clicking through your webapp. WAPT can then replay this session repeatedly and measure response times, error rates etc. WAPT allows fine-grained control over the load volume to apply to the application. You can specify the number of concurrent users and duration of test right down to user thinking time. The results are presented using simple graphs and you can drill down for more information. Spikes in response times and error rates tell you there’s a problem. You can then view results per page to find bottlenecks.
This tool is just a glorified web-browser. It interacts with your application exactly as a browser would. It has no connection to or understanding of the web application server. So it can tell you there’s a problem but it’s no use in telling you what the problem is.
Memory Profiling: NetBeans
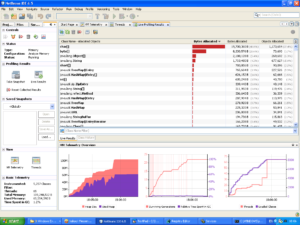
The NetBeans IDE has a nice application profiler feature. Basically a high level debugger. It attaches to the application JVM and provides some nice telemetry.
It shows at a glance heap usage and garbage collection activity. It also has a live object histogram which shows the amount of memory used per class type. This can sometimes clue you into anything that’s very wrong. Unless you really know what you’re doing though, all it tells you is that your application allocates a lot of Strings.
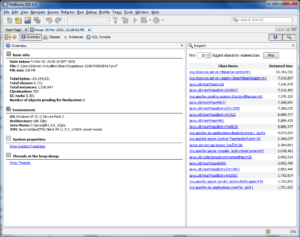
The NetBeans profiler gives you a simple way to generate heap dumps with the big ‘Take Snapshot’ button. This heap dump can be used by jhat although I wouldn’t recommend it – NetBeans does the same stuff but is nicer to use. If you open a heap dump (.hprof file) in NetBeans it can find the biggest single objects and let you inspect them.
Again though, unless anything is seriously wrong this might not tell you anything you don’t already know.
Heap Analysis: Eclipse Memory Analyzer Tool (MAT)
Eclipse MAT is available as an Eclipse plugin or as a standalone application. It offers more powerful analysis of heap dumps.
Given a .hprof heap dump file it will offer all sorts of nice slices through the data. It will provide reports on suspected memory leaks, classes loaded my multiple class loaders and so on. The Dominator Tree view is useful. It shows memory used by each object plus the sum of all everything that they keep alive. This is great for spotting what is preventing big globs of objects from being garbage collected.
Memory Analysis Tactics
I found that these three tools worked together quite nicely to detect memory leaks and other memory problems. WAPT was used to generate load and detect broad problem areas within the application. NetBeans was used to monitor overall memory usage and generate a heap dump when things started looking hairy. MAT was used to dissect the generated dump.
Unfortunately even MAT is not quite idiot proof. To analyse particularly subtle problems it does still require a good human brain to spot patterns and quirks. However, it provides so many views into the big nasty chunk of data that these patterns are way easier to spot.


Thanks for the blog!
I didn’t know about WAPT
Some hints about how to effectively work with the Eclipse Memory Analyzer (MAT) can found at my blog at http://kohlerm.blogspot.com/search/label/memory
[…] number of good profiling tools exist for Java. I've already looked at NetBeans Profiler and Eclipse MAT for memory usage and heap analysis. I would add VisualVM to that list. These are all good tools for […]