Like a many things in Tomcat, there are a number of ways to enable remote debugging. Here’s the easiest way I’ve found to enable remote debugging in a Docker container running Tomcat.
In a Dockerfile
If you’re running your own image that extends from the standard Tomcat image, just add this to the end of your Dockerfile:
ENV JPDA_ADDRESS 8000
CMD ["catalina.sh", "jpda", "run"]
The CMD here adds the ‘jpda’ option to the default Tomcat run command which enables remote debugging. The ENV entry sets the remote debug port to 8000. If you want to attach to this, don’t forget to bind the container’s port 8000 to the host.
From command line
You can do the same if you want to run the Tomcat image direct from command line:
$ docker run -e JPDA_ADDRESS=8000 -p 8080:8080 -p 8000:8000 tomcat:9 catalina.sh jpda run
Again, we’re passing the jpda option to the run command and setting the JPDA_ADDRESS environment variable. Note also that we explicitly bind the container’s 8000 port to the host. This allows us to enable the debugger by attaching to port 8000 on the Docker host.
Attaching the debugger
You can now attach a remote debugger from your IDE just as if Tomcat were running locally. If your development machine is your Docker host, you want to attach to localhost 8000. If you’re running Docker Toolbox, you’ll want to connect to the Docker Host VM (192.168.99.100 by default). Otherwise, attach to your remote Docker Host machine by name or IP address.
In IntelliJ IDEA, you can create the debug configuration from Run / Edit Configurations…, click the green + and select Remote. Set the host to your docker host machine (localhost, the Docker Toolbox VM or the remote host as appropriate) and the port as 8000. Set the name in the box at the top and click OK.
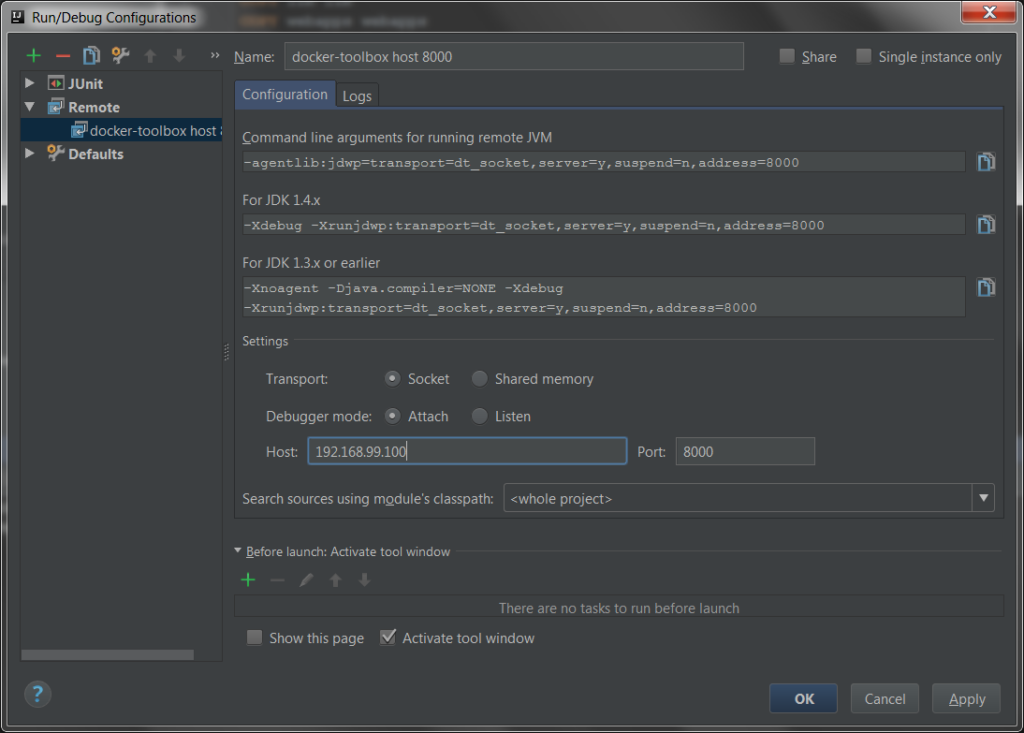
Then click the green debug icon next to your new configuration (or click Debug ‘docker-toolbox host 8000’ from the Run menu) to attach the debugger to your running Docker container. If all goes well, you’ll see a “Connected to the target VM…” message in your console window.
The process in Eclipse is similar but the configuration is in Run / Debug Configurations…
hey there, thanks for posting this! I’m having an issue where the debugger attaches and then detaches after about a minute or two, saying `Error running debug: Unable to open debugger port (192.168.99.100:8000): java.net.ConnectException “Operation timed out”`
Do you know where I need to increase that timeout? The server is still running and if I hit debug again, the same thing happens.
Hi Mika,
To increase the timeout, you can go to following menu in Eclipse
Windows –> Preferences –> Java –> Debug –> Debugger timeout: 10000